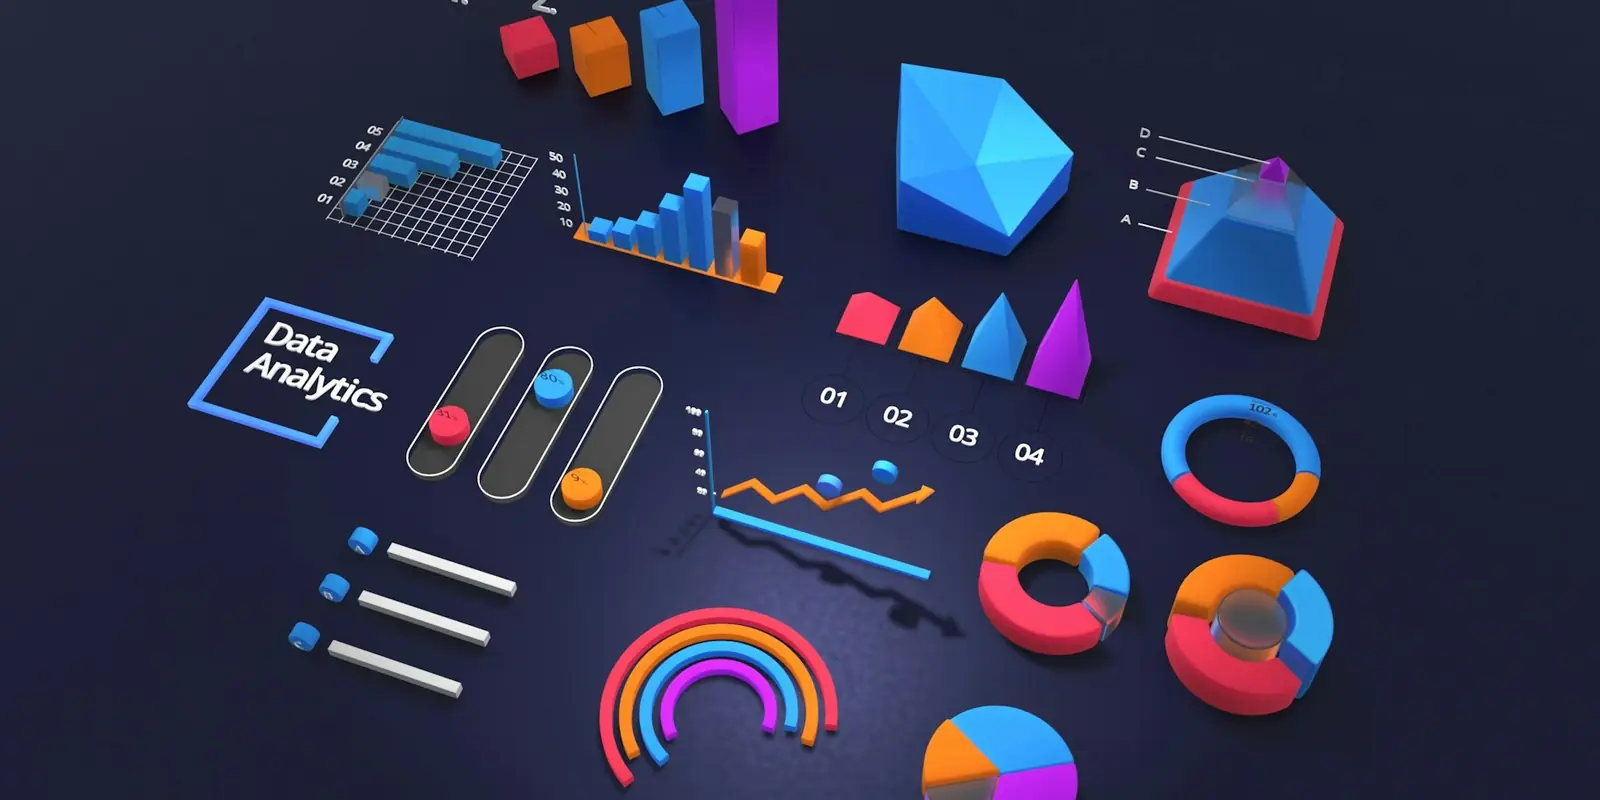
Rawalpindi · Data Analytics
Best Data Analytics Agency in Rawalpindi
ZAVYANS runs Data Analytics & BI Dashboards for Rawalpindi businesses from our Islamabad Blue Area office, a short drive across the twin cities — Marketing, sales, and operations data consolidated into a single custom dashboard that shows what's actually driving results.
Quick Answer
ZAVYANS provides Data Analytics & Business Intelligence for businesses in Rawalpindi, in person, a short drive from our Blue Area office in Islamabad. The work typically covers forecasting & trend analysis, dashboard development and data audit, with reporting and invoicing in PKR. It starts with a free proposal call.
Why Rawalpindi businesses choose ZAVYANS for Data Analytics & BI Dashboards
A short drive from Rawalpindi — in-person strategy sessions at our Blue Area office are genuinely easy to arrange
Marketing, sales, and revenue data unified into one dashboard instead of five disconnected platform logins
Metrics chosen based on what actually informs your next move, not vanity charts
Dashboards that update automatically, eliminating the manual monthly report-building grind
Making decisions on real numbers, not guesswork
Many Rawalpindi businesses collect data, sales, website traffic, ad performance, customer records, without ever turning it into something a decision can be based on. Data analytics and business intelligence work closes that gap: building dashboards and reports that show what is actually happening, not scattered numbers across five different tools.
We build reporting around the decisions you actually need to make, not a generic dashboard with every possible metric on it.
What's included in our Rawalpindi Data Analytics and Business Intelligence service
Dashboard development
Clear, focused dashboards built around decisions, not metric overload.
Data audit
Understanding what data you already have and where the gaps are.
Reporting automation
Reports that update automatically instead of being built by hand every week.
Training
Making sure your team can actually read and act on the dashboards.
Cross-platform data integration
Combining data from ads, website, sales and CRM into one view.
Forecasting and trend analysis
Using historical data to inform future planning.
Dashboards built for decisions, not decoration
A dashboard nobody checks is wasted work. We start every project by asking what decision the data needs to support, a budget shift, a hiring call, a pricing change, and build backward from there, so what gets built actually gets used.
Who we help
E-commerce
Sales, traffic and ad performance in one connected view.
Growing SMEs
Moving from spreadsheets to real, automated reporting.
Multi-location businesses
Comparing performance across branches or regions.
Real estate agencies
Tracking lead sources and conversion across projects.
How a Data Analytics and Business Intelligence engagement runs
- Step 1
Audit
We review what you have today against the result you actually want.
- Step 2
Build
Tracking, creative, pages or systems go in before spend or launch.
- Step 3
Launch and test
Work goes live and is tested in rounds with a clear weekly read-out.
- Step 4
Grow
Budget and effort follow what is actually producing results.
Rawalpindi context for data analytics and BI
Rawalpindi runs on an older, denser commercial core (Saddar, Raja Bazaar) alongside its own newer housing societies, and buyers here often respond better to a direct, value-led message than a polished corporate one.
- Saddar and Commercial Market, the traditional commercial core
- Satellite Town and Chandni Chowk, dense residential and retail areas
- Bahria Town and DHA Rawalpindi, newer housing societies with growing demand
- Murree Road and Chaklala, high-traffic corridors close to Islamabad
data analytics and BI in Rawalpindi: what works here
Rawalpindi businesses, from wholesalers and retailers to schools and clinics, usually need practical software that saves staff time rather than complex platforms.
- Mobile-first tools that run well on the Android phones your staff and customers use
- Urdu interfaces where staff or customers prefer them
- Integrations with WhatsApp, JazzCash, Easypaisa and bank payments
- Training at your premises in Rawalpindi, a short drive from our Blue Area office
Popular services for Rawalpindi businesses

AI Workflow Automation
AI agents that automate internal operations — data entry, CRM syncing, follow-ups — end to end.

Software Development
Custom software and internal tools built to solve the specific problem off-the-shelf tools can't.
Cloud & DevOps Consulting
Infrastructure, deployment, and scaling support so your software stays fast and reliable under load.

Podcast Production & Marketing
Founder-led and branded podcasts produced and distributed to actually build an audience.


Short-Form Video & Content Production
Reels, TikToks, and Shorts produced to actually get watched, not just published.

Sales Development / Outbound SDR Services
An actual outbound team booking meetings, not just the software behind it.
Looking for something else? See all 59 services →
Where our Rawalpindi Data Analytics clients are based
Most of our Rawalpindi clients are headquartered in a handful of areas, which is useful context whether or not your project involves local targeting directly. In Rawalpindi that typically means:
- Saddar, Raja Bazaar and Committee Chowk
- Commercial Market, Satellite Town and Scheme III
- Chaklala, Westridge and the Peshawar Road corridor
- Murree Road and Adiala Road
- Bahria Town and DHA, which span the twin cities
Wherever your team is based inside Rawalpindi, the engagement runs the same way: kickoff, build, and ongoing support with the same team throughout.
Questions to ask before hiring a Data Analytics company in Rawalpindi
- Can they show real Data Analytics work for Rawalpindi businesses, and can you speak to a client directly?
- Is there a real office you can visit? We're a short drive away in Blue Area, Islamabad.
- Who owns the work at the end of the engagement, the code, accounts, or assets? It should be you.
- How do they report progress along the way, not just deliver a handoff at the end?
- If you switch agencies later, is everything transferable without starting over?
Data Analytics Agency near you in Rawalpindi
If you are searching for data analytics, reporting dashboards or business intelligence services in Rawalpindi, this is the service. We work with businesses across Rawalpindi, including Saddar, Satellite Town, Commercial Market, Chaklala, Westridge, Bahria Town, DHA and along Murree Road and Adiala Road.
- Our office is in Blue Area, Islamabad, a short drive across the twin cities
- Monday to Saturday, 10am to 6pm, with meetings in Rawalpindi on request
- Phone and WhatsApp: +92 336 0051166
Need more than one service? See everything from our digital marketing agency in Rawalpindi.
Results for Islamabad and Rawalpindi businesses
Real engagements for clients in the twin cities. Client names are withheld and figures are rounded ranges.

Case study · 2025
ZAVYANS grew a diagnostic lab network in 6 Pakistani cities from ~20-50 to 100-200 patient enquiries a month per city, with 20-50% lower cost per lead (2025).
Read the case study →

Case study · 2025
ZAVYANS grew real estate developers in Lahore, Islamabad, Rawalpindi and the Galyat from ~50-150 leads a month to 600+, with 20-50% lower cost per lead (2025).
Read the case study →

Case study · 2025
ZAVYANS grew an immigration consultancy in Islamabad and Rawalpindi from ~50-100 to 300-500 leads a month, with 20-50% lower cost per lead (2025).
Read the case study →
Frequently asked questions
Why choose ZAVYANS for data analytics and BI in Rawalpindi?
We build reporting around the specific decisions you need to make, not a generic dashboard with every possible metric on it.
What tools do you use for dashboards?
We choose based on your existing systems and budget, from spreadsheet-based reporting to dedicated BI tools.
Can you combine data from multiple platforms?
Yes, connecting ads, website, sales and CRM data into one view is a core part of the service.
Do you build one-off reports or ongoing dashboards?
Both, depending on your needs, though ongoing automated dashboards typically deliver more value over time.
Do you come to Rawalpindi for meetings and training?
Yes. We're a short drive away in Blue Area, Islamabad, and we can meet and train your staff at your premises in Rawalpindi.
Can you help us forecast future performance?
Yes, trend analysis and forecasting based on your historical data is part of the service where relevant.
Will our team be able to maintain this themselves?
Yes, training is included so your team can read, and where needed adjust, the dashboards.
Do you also serve Islamabad?
Yes, we provide data analytics and BI services to businesses in Islamabad and across Pakistan.
What do you need from me to start?
Access to your current data sources and a clear sense of the decisions you want the data to support.
Is there a Data Analytics agency near me in Rawalpindi?
We serve Rawalpindi from our Blue Area office in Islamabad, a short drive across the twin cities, including Saddar, Satellite Town, Chaklala, Bahria Town and Adiala Road. Most work is coordinated remotely and over WhatsApp, with in-person meetings available on request.
Data Analytics & BI across Pakistan
All AI services in Rawalpindi
Let's build something
Ready to get started with Data Analytics in Rawalpindi?
Tell us what you're trying to grow. We'll come back with a plan, not a sales pitch.
or email info@zavyans.com
Last updated: